
Oh, the treasures residing within…
I saw this colorful juxtaposition in the December Tech Review. By studying the genetic variations in 3,200 Europeans, and mapping the primary differences in their point mutations (500,000 SNPs) along two axes, a remarkable image of Europe emerges.
To be clear, the graph on the right plots individuals on the x,y axes entirely based on their genes. The color of the points shows where they live, so you can compare the clustering to the map on the left.
Notice how physical barriers, like the water around Italy or the mountains between Spain and France restrict the cross-breeding of peoples, reflected in the accumulated genetic separations over many generations.
And the length of Italy on the right graph suggests less cross-breeding between North and South than geographic distance alone would predict, and in contrast to countries like France (love your neighbor, maybe two).
“The resolution of the genetic map was so precise that the investigators were able to find genetic differences among French, German and Italian-speaking Swiss individuals, with French speakers being more similar to the French, German speakers to Germans and Italian speakers to Italians.” – Research summary from UCLA
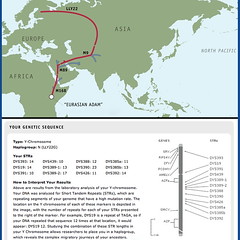
I have been fascinated by genetic archaeology, from the early work that derived the migration of groups of people (Roman Empire, Ice Age, etc), and then individuals (I’ll share my genetic migration map below).

Leave a Reply